Agent Performance Metrics That Actually Move Enterprise ROI
Learn which agent performance metrics drive enterprise ROI, how to measure reliability and cost, and what to track in dashboards for governance and trust.
Written by HeadOfAgents
The most popular advice about agent performance metrics is also the most dangerous: pick one headline number, usually task success rate, and optimize the program around it. That approach gives executives a clean chart while hiding the failures that determine whether an agent is economically viable and safe to scale. A system can complete many tasks, yet waste resources through retries, make incorrect tool decisions, or escalate work in ways that create more human effort than automation removes.
A stronger operating model treats performance as a three-layer stack. The outcome layer asks whether the agent achieved the intended business result. The reliability layer asks whether it did so consistently, efficiently, and within acceptable latency and cost. The governance layer asks whether the agent's decisions, tool use, data handling, and escalation behavior stayed within approved boundaries.
That stack is more demanding than a single score, but it produces a dashboard a CAIO can defend to the board. It connects technical behavior to ROI without pretending that speed or automation alone proves value.
Why One Number Will Never Define Agent Performance
Task success rate matters. It just isn't sufficient. The metric has become central because it captures whether an agent completes work end to end without human intervention. Current guidance commonly defines it as successfully completed tasks divided by total attempted tasks, multiplied by 100, and recent production benchmarks for well-implemented structured tasks converge around 85% to 95%, with one benchmark identifying 87% or higher as a practical production-readiness threshold. See the current guidance on AI agent success metrics.
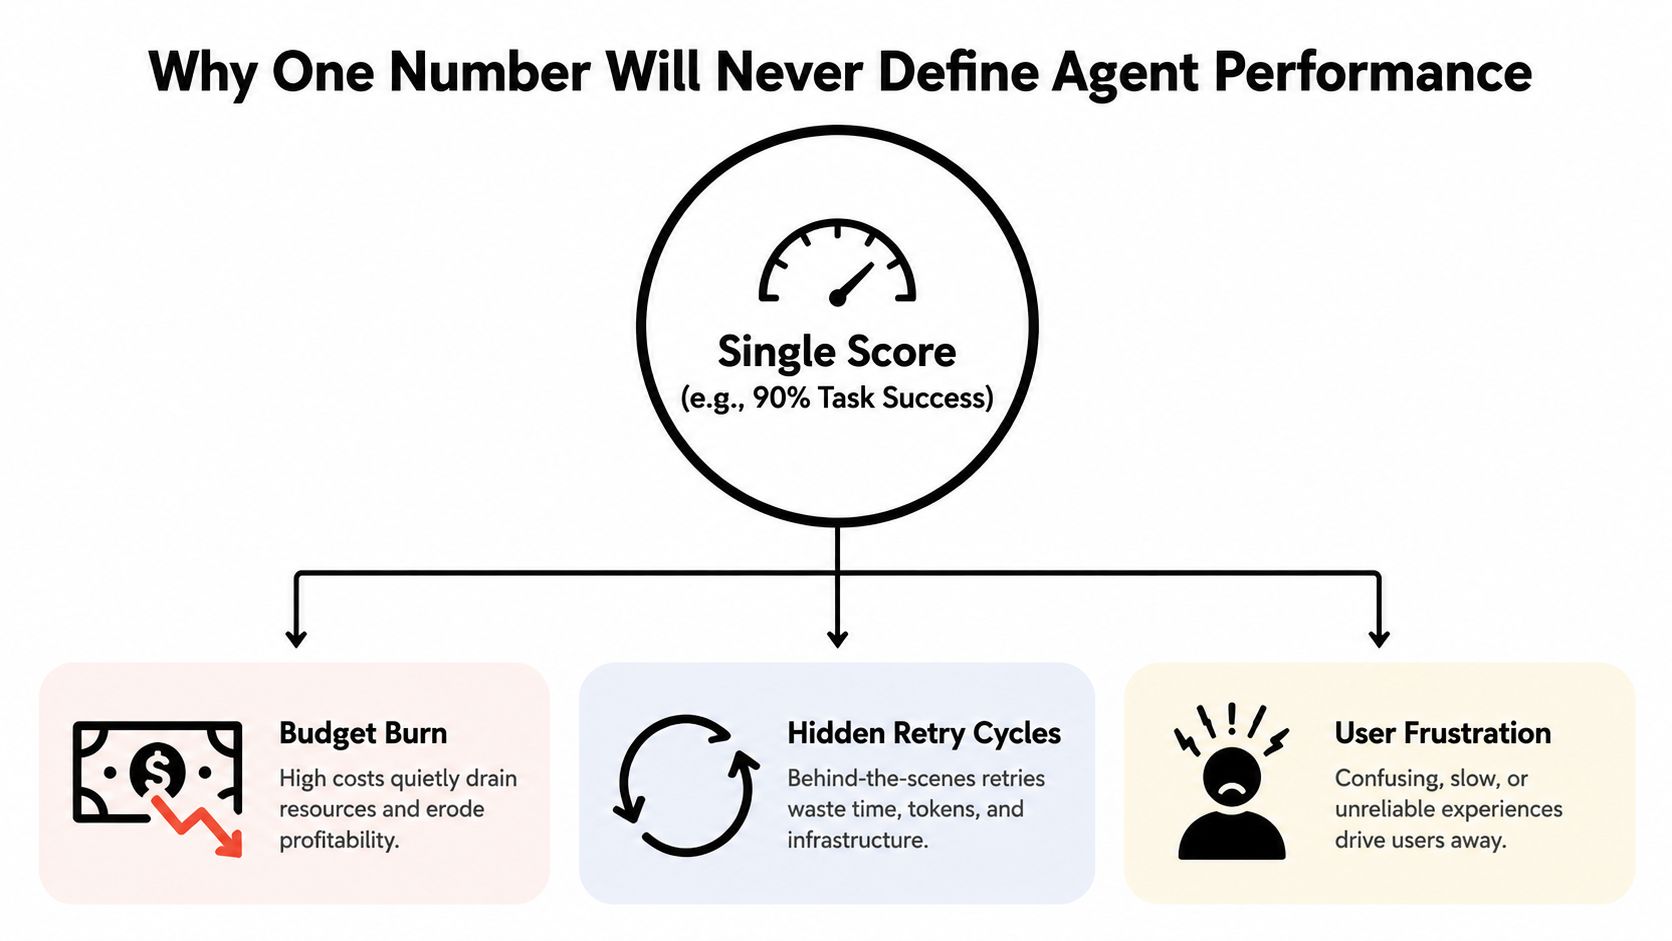
Those figures are useful only when the task definition is honest. A “successful” run might still involve excessive retries, unnecessary tool calls, a costly model fallback, or an escalation that should have been avoided. If the dashboard records only the final outcome, leadership sees the destination but not the route.
Outcome is only the first layer
The outcome layer answers a straightforward question: did the agent do the job? For a support workflow, that could mean resolving the customer's issue. For an internal operations workflow, it might mean producing a validated record or completing an approved transaction. Task completion is valuable because it links an agent's technical behavior to an operational result.
Resolution rate provides a mature enterprise analogue. A 2026 enterprise KPI framework reports average AI resolution rates of 55% to 76%, while top performers exceed 80%, but it also warns that definitions vary by vendor, task scope, and measurement method. Those figures come from the enterprise AI agent KPI framework, and they should be treated as comparable only after the underlying definitions are aligned.
Reliability and governance expose the hidden cost
Reliability asks whether the result is repeatable and economical. Governance asks whether the path was acceptable. These layers catch problems that a headline success score can't:
- Budget burn: repeated attempts and oversized context can raise cost per completed task.
- Hidden retry cycles: an agent may eventually succeed after inefficient recovery behavior.
- Unsafe tool use: the final answer may look correct even though the agent invoked the wrong tool or supplied an unsupported parameter.
- Poor escalation judgment: an agent can inflate apparent safety by sending too much work to human operators.
- Unstable behavior: one successful run doesn't prove that repeated executions will produce the same result.
Practical rule: Never approve scale based on task success alone. Require an outcome score, a repeated-run reliability view, and a trajectory-level safety view.
A board-ready dashboard should therefore show the business result, the operating cost and variance behind that result, and the controls that prevented unacceptable actions. Vanity dashboards optimize the easiest number to improve. Governance dashboards reveal whether the number deserves trust.
The Four Categories Every Agent KPI Falls Into
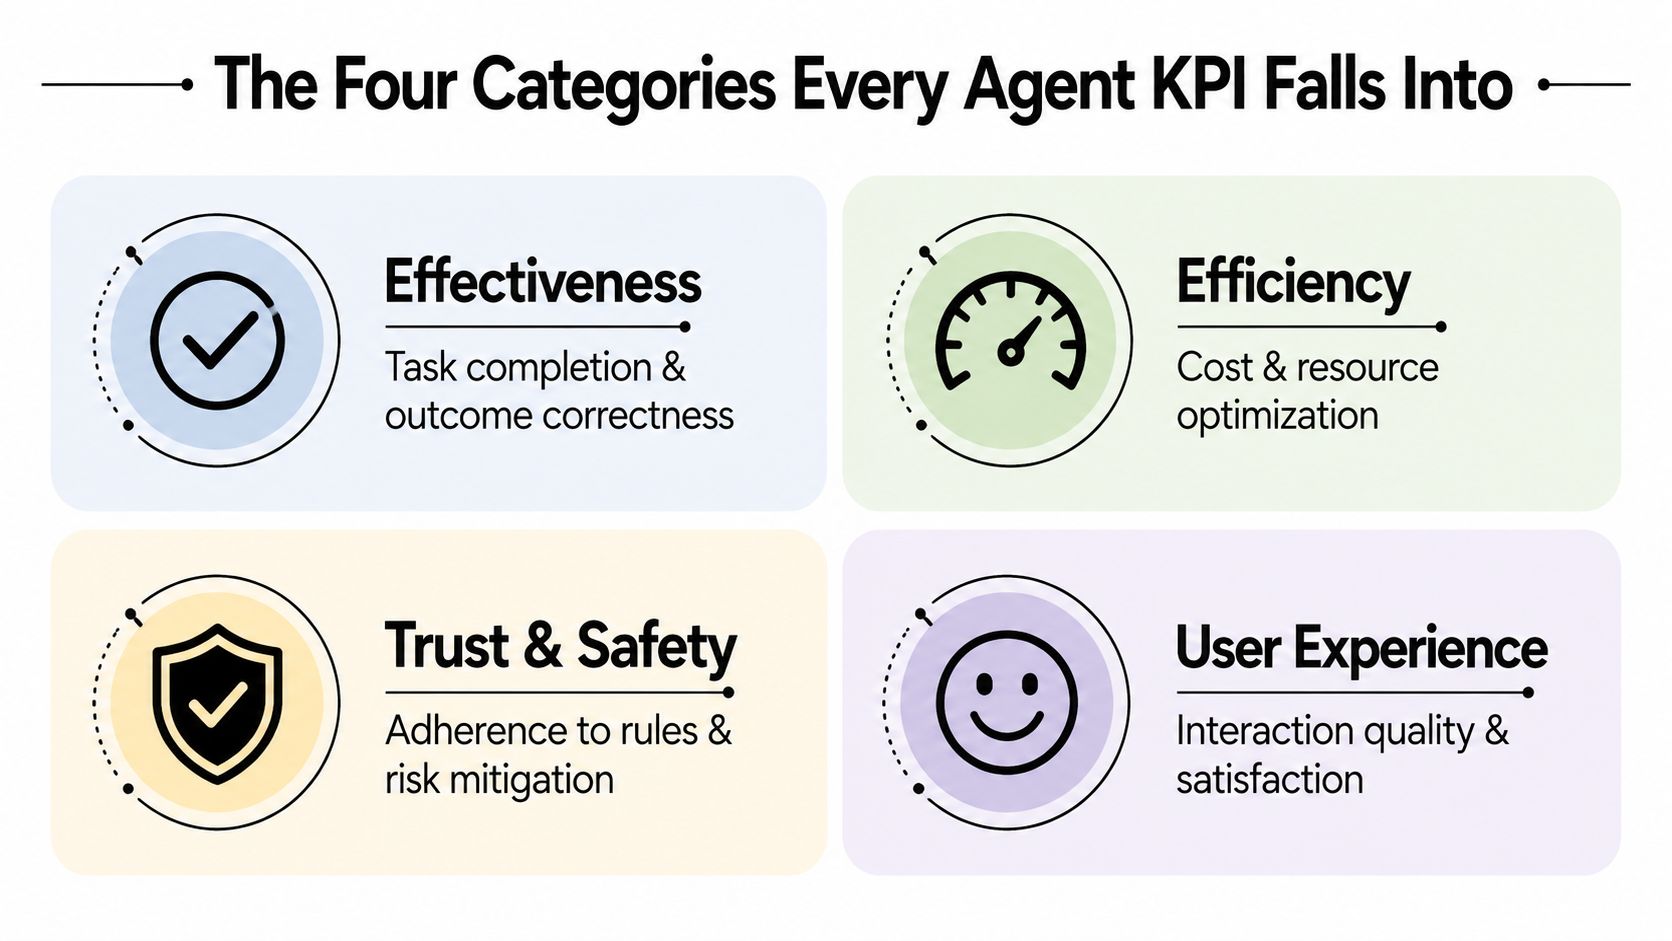
A practical KPI system starts with four buckets: effectiveness, efficiency, reliability, and trust. Together, they show whether an agent achieves the right outcome, uses resources responsibly, behaves consistently, and stays within an acceptable operating boundary.
These categories should not collapse into one success score. A high automation rate can conceal unsafe tool use, costly retries, or unstable behavior in production. Put the four buckets on every leadership dashboard, then read them as a connected view of performance.
Effectiveness measures the outcome
Effectiveness shows whether the agent completed the intended task and produced a correct result. Task completion rate, resolution rate, first-contact resolution, containment, and outcome correctness belong here. Separate completion of an interaction from achievement of the user's actual goal.
A support agent that sends a response has completed an output step, but the customer's issue may remain open. A document agent that generates a file may still produce something unusable or noncompliant. Define success in business terms before deployment, then record whether each run met that definition.
Efficiency measures the operating cost
Efficiency connects agent behavior to economics. Track cost per completed task, cost per resolved task, latency, token consumption, and tool-call volume. These measures explain why agents with similar outcome rates can create very different financial results.
Pair cost with quality and completion. An expensive run may be justified for a complex, high-value task. An expensive run that delivers the same result as a simpler path points to waste in architecture, prompting, or tool selection.
Reliability measures repeatability
Reliability deserves its own view because average performance can hide production instability. Track variance across runs, retry behavior, recovery from tool errors, worst-case performance, and consistency for equivalent inputs. An agent that succeeds unpredictably creates planning and support problems.
The technical measurement stack should include task completion rate, pass@k, worst-of-n, path correctness, harmful-call rate, step efficiency, tool-call accuracy, and cost per task, as described in agent performance benchmarking guidance. These measures distinguish a single successful run from behavior that remains repeatable, safe, and economical.
Trust protects the operating boundary
Trust includes hallucination rate, policy compliance, escalation appropriateness, restricted-action attempts, and traceability. A trustworthy agent avoids unacceptable actions and leaves a record reviewers can reconstruct and verify.
Report these four categories as separate dashboard columns, with trends and exceptions visible to leadership. Activity counts, raw message volume, and total tool calls support diagnosis, but they should not become headline KPIs. A metric deserves executive attention only when it clarifies the outcome, operating burden, repeatability, or governance of the agent.
Effectiveness and ROI Metrics That Hold Up to the Board
Boards care about outcomes, economics, and risk-adjusted confidence. Start with two distinct outcome measures: resolution-style performance and end-to-end task completion.
Resolution-style performance records whether a defined service issue reached an operational endpoint, such as a ticket being closed or an answer being accepted. End-to-end completion goes further. It checks whether the agent achieved the full objective across its reasoning steps, tool calls, validations, and required handoffs.
That distinction matters because a workflow can report high resolution while leaving rework, reopenings, or human cleanup outside the measurement boundary. Report both the immediate resolution outcome and the downstream quality outcome.
Define the numerator before discussing ROI
Use clear definitions for common effectiveness KPIs:
- Automation rate: the share of eligible work handled without human intervention.
- Containment rate: the share of interactions completed within the automated channel without transfer.
- Deflection rate: the share of demand diverted from a human queue or service path.
- First-contact resolution: the share of cases resolved during the initial interaction, without a repeat contact.
- End-to-end success rate: successfully completed tasks divided by total tasks attempted, multiplied by 100, using the approved task definition.
The last metric is central to modern agent evaluation because it measures completion rather than a model's isolated accuracy or precision. The AI agent success metrics framework also recommends pairing task success with latency, hallucination rate, and cost per completed task.
Use a finance-friendly ROI equation
A practical ROI expression is:
ROI = (value of automated tasks minus agent operating cost) divided by total agent program cost
The calculation is only credible when “value” has a documented basis and the cost includes the full program. Include model usage, infrastructure, monitoring, evaluation, human review, remediation, and program management. If the business can't agree on the valuation method, label the result as an operating estimate rather than presenting false precision.
Don't average high-value and low-value use cases into one blended figure. A low-risk workflow can subsidize a difficult workflow in the aggregate, making the portfolio look healthy while one important process remains uneconomic or unsafe. Report ROI by use case, task class, and risk tier.
Avoid the boardroom traps
Counting every human handoff as an automation failure produces the wrong incentive. Some escalations are appropriate, especially when the agent lacks authority, evidence, or confidence. The right question is whether the escalation was necessary and correctly routed, not whether the agent avoided a human.
Ignoring quality is another common error. An automated task that creates rework has not generated the claimed value. Likewise, a high containment rate can conceal poor customer outcomes if users abandon the interaction or return through another channel.
| Metric | Formula | Why It Matters to the Board |
|---|---|---|
| Task success rate | Successfully completed tasks / total attempted tasks × 100 | Shows whether the agent achieves the defined business objective |
| Resolution rate | Resolved cases / total eligible cases | Connects automation to an established service outcome |
| Automation rate | Automated eligible tasks / total eligible tasks | Shows workload handled without direct human intervention |
| Cost per resolved task | Total agent operating cost / resolved tasks | Reveals whether scale improves or damages unit economics |
| ROI | Value of automated tasks minus operating cost, divided by total program cost | Connects agent deployment to financial return |
| Escalation appropriateness | Appropriate escalations / total escalations | Separates responsible handoff from avoidable failure |
Include these metrics on the executive summary slide: end-to-end success, resolution, automation, cost per resolved task, ROI by use case, escalation appropriateness, and material safety exceptions. For the design choices behind the agent's context and instructions, see this guide to context engineering for agents.
Latency, Cost, and Reliability Under Repeated Runs
Pass@1 is a development signal, not a production confidence statement. It tells you whether the agent succeeded on one attempt. It doesn't tell you whether the same workflow will behave consistently across repeated executions, changing inputs, tool failures, or long-running context.
For stochastic agents, pass@k measures the probability of at least one success across k attempts. That can be useful when a system is allowed to retry or select among candidate trajectories, but it can also flatter an unreliable agent. Worst-of-n provides the opposite perspective by taking the minimum score across repeated runs and exposing the reliability floor.
Measure the path, not only the endpoint
Step efficiency is defined as optimal steps divided by actual steps. A value below 1.0 quantifies unnecessary work and often correlates with higher latency and token cost, according to technical guidance on benchmarking agent performance.
A production cost review should combine:
- Latency percentiles: p50 shows the typical experience, while p95 and p99 expose slow-tail behavior.
- Tool-call cost: measure tool usage per completed task, not just per session.
- Retry overhead: record failed calls, repeated calls, and recovery branches separately.
- Token cost: distinguish input and output consumption where possible.
- Cost per resolved task: divide total execution cost by tasks that reached the approved resolution definition.
A cheap first attempt can become expensive after retries. Conversely, a slower path may produce fewer failures and lower total cost per resolved outcome. The correct unit of analysis is the distribution of cost and latency for completed work, not the average of selected demos.
Use realistic evaluation slices
For support triage, compare routine requests with ambiguous requests and measure whether repeated runs select the same routing outcome. For claims processing, test missing evidence, conflicting fields, and tool errors rather than only clean submissions. For code refactoring, evaluate whether the agent preserves required behavior after multiple executions, not just whether one patch passes a narrow test.
| Metric | Single-Run View | Repeated-Sampling View | Why It Matters |
|---|---|---|---|
| Pass rate | Did this attempt succeed? | How often does success recur across attempts? | Exposes brittleness |
| Pass@k | Success opportunity across k attempts | Success probability under allowed sampling | Shows recovery potential |
| Worst-of-n | Not visible | Minimum result across repeated runs | Establishes a reliability floor |
| Step efficiency | Steps taken on one run | Distribution of productive versus unnecessary steps | Connects behavior to cost and latency |
| Latency | One duration or average | p50, p95, and p99 distribution | Reveals slow-tail operational risk |
| Cost per resolved task | Cost of one execution | Total cost across retries and failed attempts | Measures real unit economics |
Before approving production scale, require a representative task mix, repeated executions, failure-path accounting, tool-error recovery data, and cost calculated over resolved outcomes. The agent workflow automation guide is useful background for mapping those measurements to operational workflows.
Trust, Safety, and Trajectory-Level Failure Modes
A high automation rate can conceal unsafe behavior. An agent may deliver an acceptable result while using an unauthorized tool, exposing sensitive context, or taking an unstable route that fails under slightly different conditions. Measure agent performance as a three-layer stack: outcomes, reliability, and governance. Outcome scores show what happened. Trajectory audits show how it happened and whether the process was allowed, grounded, and explainable.
Enterprise governance needs both views. A correct final answer does not excuse an unsupported parameter, an unnecessary tool call, or a policy violation that caused no visible damage in that run.
Instrument every meaningful action
Structured trace logs should capture the user request, relevant context, model decision, selected tool, parameters, tool response, policy checks, retries, escalation decision, and final output. Retain enough context for a reviewer to reconstruct the event without relying on an informal transcript.
Track these failure modes separately:
- Incorrect tool invocation: the agent selects an unnecessary tool or the wrong capability.
- Hallucinated information: the agent states unsupported facts or invents parameters not grounded in available context.
- Policy bypass attempts: the agent follows instructions that conflict with access, privacy, or safety rules.
- Inappropriate escalation: the agent transfers work it could safely complete, or keeps work that requires human authority.
- Step-level drift: the agent gradually departs from the approved workflow during a multi-turn interaction.
Do not collapse these events into one accuracy score. The framework for measuring tool-call success, hallucination, escalation, and traceability supports a more useful control view, especially when automation rises while tool use and recovery behavior become less predictable.
Put safety metrics into governance reporting
A minimum safety set includes tool-call accuracy, hallucination rate, escalation appropriateness, and policy compliance rate per 1,000 actions. Add restricted-action attempts, sensitive-data handling events, and recovery quality when the workflow carries material risk.
Review sampled live trajectories weekly, prioritizing failures and unusual changes. Run red-team exercises on a recurring governance schedule and after material model, prompt, tool, or policy changes. Assign an owner and a response threshold to every metric. The objective is not a perfect score. It is early detection of a weakening control boundary, before business outcomes expose the regression.
Higher automation can mean weaker control when the agent takes more unverified actions without improving outcome quality.
The governance question is direct: which actions did the agent take, under what authority, and with what evidence? A dashboard that reports automation without those answers is incomplete.
Reporting Cadence and Dashboard Examples
A single dashboard view cannot serve every decision. Board reporting should show value, stability, and control, while operating teams need alerts that support immediate intervention. Build the cadence around the three-layer stack: outcomes, reliability, and governance. Give every tile an owner, a definition, a threshold, and a response plan.
Daily review catches operational anomalies
Operations should review material safety events, abrupt cost changes, failed tool calls, queue growth, latency outliers, and unusual escalation patterns each day. A high automation rate does not clear an agent for scale if unsafe tool use or unstable recovery is increasing underneath it.
Every alert needs a named responder and a documented action. Responses may include pausing a workflow, disabling a tool, limiting task scope, or routing a task class to human review. Record the decision and its reason so the next review can distinguish a one-off incident from a production trend.
Weekly review detects reliability drift
The weekly review should examine repeated-run reliability, retry behavior, trajectory samples, and changes in failure modes. Track Pass@k, worst-of-n, path correctness, and recovery quality beside aggregate success. A strong average can hide one unacceptable path, repeated retries, or a tool call that reaches the wrong target.
Use control charts to show variance, and annotate them with model, prompt, policy, or tool changes. A trend without an explanation remains an open investigation.
Monthly review connects outcomes to the forecast
The monthly executive review should report outcome KPIs, cost per resolved task, ROI by use case, and variance against the approved business case. Separate portfolio averages from individual workflows. Leaders need to see which use cases create value, which consume human intervention, and which require remediation.
Quarterly review resets guardrails
Quarterly governance reviews should cover guardrails, red-team findings, material incidents, policy or model changes, and scale decisions. Use failure-mode heatmaps and stacked bars for cost mix. Avoid gauges and oversized unannotated trend lines. They create confidence without showing what changed or what leaders should do.
Use four dashboard quadrants:
| Quadrant | Recommended tiles |
|---|---|
| Business outcomes | End-to-end success, resolution, automation, first-contact resolution |
| Reliability | Pass@k, worst-of-n, retry rate, path correctness |
| Cost and latency | Cost per resolved task, p50, p95, p99, step efficiency |
| Trust and safety | Tool-call accuracy, hallucination rate, escalation appropriateness, policy compliance |
Keep technical drill-downs available, but keep raw traces out of the executive view. The main dashboard should answer three questions quickly: is value being created, is performance stable, and is the agent operating within control?
Who Owns the Numbers and What to Do in 30 Days
Agent metrics need one accountable operator. The Head of Agents or Director of Agent Operations should own definitions, dashboard integrity, review cadence, scale recommendations, and the connection between agent behavior and business outcomes. This role must manage performance as a three-layer stack: outcome, reliability, and governance.
Engineering owns instrumentation, latency telemetry, tool integration quality, and remediation delivery. Risk and security own policy controls, red-team design, incident review, and approval criteria for sensitive actions. Finance validates cost allocation and ROI assumptions. Product and operations leaders define task boundaries and acceptance criteria.
The accountable owner must have decision rights. If nobody can pause an agent, narrow its scope, or reject a scale request, the dashboard is reporting theater. A high automation rate cannot override unsafe tool use or unstable production behavior.
A 30-day diagnostic
Week one, inventory the estate. List every production and pilot agent, its use case, task boundary, data access, tools, human handoffs, business owner, technical owner, and risk tier. Mark each KPI that lacks a written definition, owner, or escalation rule. Use the AI agent team guide to clarify leadership responsibilities where the operating model is fragmented.
Week two, establish the baseline. Pull effectiveness and cost data for every active workflow. Reconcile task success, resolution, escalation, latency, retries, and cost per completed outcome. Keep workflows separate when their task scopes differ. A blended portfolio number can hide a failing agent behind a stronger one.
Week three, audit trajectories. Review a 200-sample slice of real interactions. Label tool decisions, hallucinations, escalation quality, policy adherence, and step-level failures, then compare those findings with headline outcome metrics. This sample size guides the diagnostic exercise, not a performance benchmark.
Week four, publish and govern. Launch a leadership dashboard with outcome, reliability, cost, latency, and trust views. Assign metric owners, set review dates, and document the action attached to each threshold. Technical teams can retain trace-level drill-downs, while executives receive summarized evidence and exceptions.
The gating question is direct: can the program demonstrate valuable outcomes, repeatable behavior, and safe trajectories under representative production conditions? If not, pause expansion and remediate the failing layer. Automation is an outcome metric, not permission to scale an uncontrolled system.
Head of Agents helps enterprises identify accountable agent leaders, run an Agent Readiness Audit, and structure hiring, governance, and 90-day operating plans around measurable performance. Visit Head of Agents to turn current agent metrics into an owned dashboard and a defensible scale decision.